Status. Version 0.2 is a scientifically inspectable toy economy, not an empirically calibrated forecasting model. Its results illustrate core economic mechanisms and an experimental workflow; they should not be interpreted as estimated impacts of real-world policies.
Research question
How does a temporary contraction in household demand ripple through consumption, production, unemployment, business solvency, price levels, and wealth inequality? Furthermore, to what degree can targeted cash transfers to households mitigate these adverse effects?
The project deliberately starts small. Every state transition, market transaction, and random draw is explicitly coded. This transparency ensures that future empirical or AI-driven agent behaviours can be benchmarked against a clean, rule-based baseline that readers can audit line by line. The model is built in Python using the Mesa 3 agent-based modeling framework, backed by automated tests enforcing strict accounting consistency and reproducibility.
Model structure
- Households differ in their skill levels, accumulated wealth, and marginal propensity to consume. They supply labour, receive wages or targeted government transfers, purchase consumer goods, and carry forward remaining liquid assets across periods.
- Firms vary by productivity, cash reserves, wage offers, and posted prices. They adapt their labour demand to smoothed historical sales (using adaptive expectations, placing a 0.30 weight on current-period sales) and target production at 105% of anticipated sales. When paying workers, firms disburse the solvent share of their wage bill, bring finished goods to market, and adjust prices (+1% / −1%) and wages (+0.2% / −0.2%) based on inventory clearance rates. A firm exits the market permanently once it has both zero workers and zero liquid cash. Version 0.2 does not feature new firm entry.
- The shock is implemented as an exogenous, observable reduction in planned expenditure: the demand multiplier drops from 1.0 to 0.65 across periods 20 through 32.
- The transfer program injects 8 currency units per period into every unemployed household during the shock window. It is not designed to neutralize the contraction entirely, but to provide immediate liquidity to constrained agents. Government outlays are tracked in a dedicated ledger. Because v0.2 excludes taxation and public borrowing, transfers represent direct money injections, and the global monetary identity shown above is verified by automated accounting assertions.
The intra-period sequence of events is fundamental to the model's transmission mechanisms: eligibility for transfers is determined immediately after monthly labour-market matching concludes, allowing newly transferred income to be deployed within the very same period's goods market.
What the first comparison shows
The initial diagnostic evaluation evaluates 20 matched random seeds across 200 households, 20 firms, and an horizon of 60 months. For each seed, three distinct trajectories are simulated from identical initial conditions and random streams: a baseline run, a shock run, and a shock-plus-transfer run. Treatment effects are calculated within each seed prior to aggregation. Bracketed values denote simulation intervals (5th to 95th percentiles across seeds), rather than inferential confidence intervals.
| Outcome (Difference from baseline) | Shock alone, median [p05, p95] | Shock + transfer, median [p05, p95] |
|---|---|---|
| Peak unemployment rate | +0.125 [+0.025, +0.200] | +0.035 [−0.069, +0.130] |
| Shock-window consumption | −6,284.84 [−6,761.80, −5,666.76] | −2,333.90 [−3,247.03, −874.30] |
| Shock-window production | −1,790.83 [−2,068.13, −1,516.73] | −846.91 [−1,079.58, −505.14] |
| Net transfer effect (Transfer − Shock alone) | Median [p05, p95] |
|---|---|
| Peak unemployment rate | −0.080 [−0.101, −0.058] |
| Shock-window consumption | +3,702.60 [+2,972.28, +4,680.64] |
| Shock-window production | +931.57 [+726.19, +1,181.46] |
| Cumulative government spending | +3,040 [+2,492, +3,884] |
Within the model, lower household expenditure propagates to reduced sales, dampening expected demand and ultimately contracting production and employment with a lag. The transfer policy noticeably dampens this downward spiral across all 20 matched seeds for all three primary outcomes.
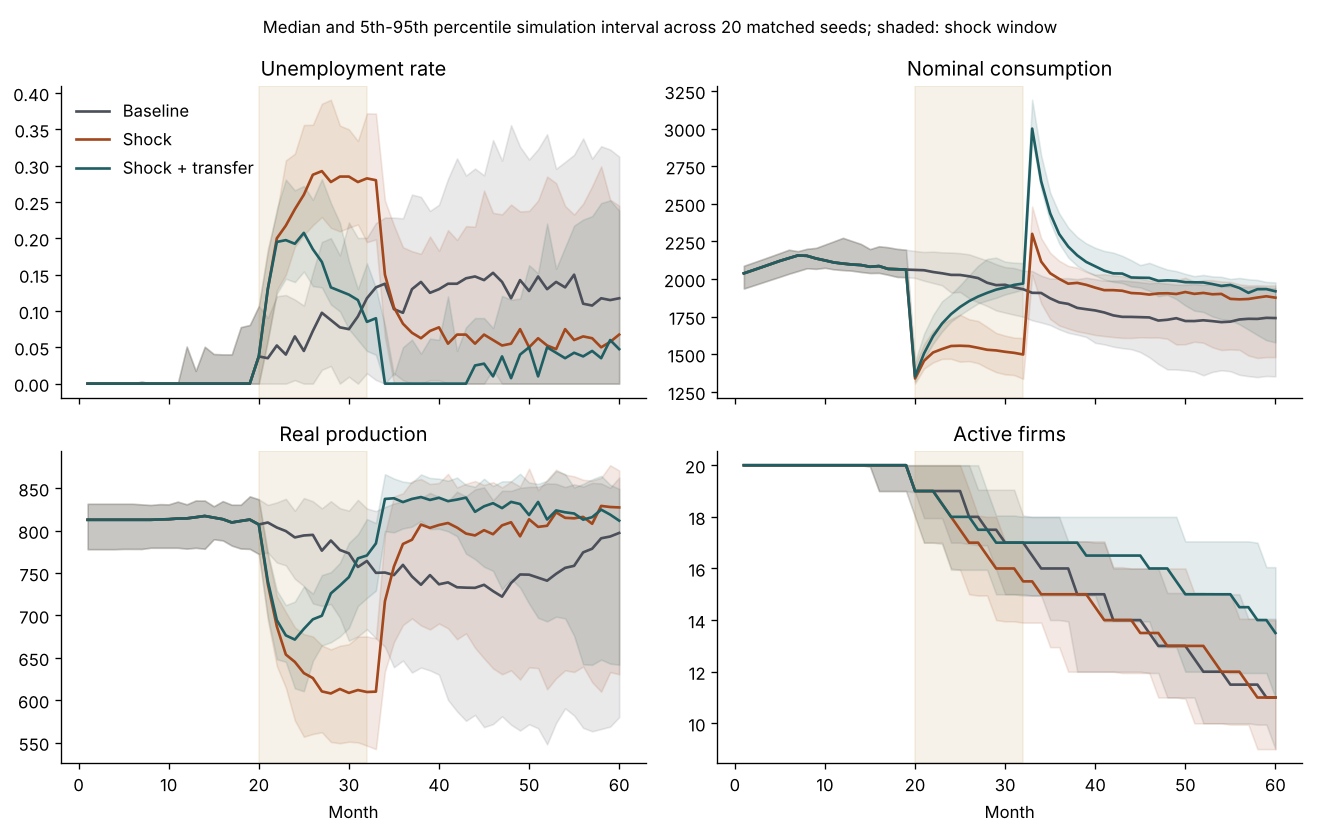
This plot is generated directly from the simulation output file scenario_timeseries.csv and is reproduced alongside the summary tables in the reader notebook. Two specific dynamics warrant careful consideration prior to drawing conclusions:
- Baseline attrition: Even in the unshocked baseline, several seeds experience firm bankruptcies and rising unemployment over time, driven by price competition and liquidity constraints. The research protocol schedules sensitivity analyses to investigate this baseline volatility.
- Post-shock consumption surge: When the demand multiplier normalizes at the end of the shock window, aggregate consumption spikes sharply as households release unspent liquidity accumulated during the downturn. The shocked and baseline trajectories briefly cross. Both phenomena reflect internal model dynamics rather than empirical stylized facts.
What v0.2 is — and what it is not
This model is:
- A transparent, fully inspectable mechanism model grounded in an experimental workflow.
- A controlled framework featuring matched random seeds, pre-registered evaluation metrics, paired contrast calculations, stored seed registries, and comprehensive monetary accounting audits for every run.
- Governed by explicit verification standards: identical random seeds must reproduce runs bit-for-bit, matched scenarios must remain identical prior to intervention, transfers must strictly respect program windows and targeting criteria, and private balances must fluctuate solely through tracked government disbursements.
This model is not:
- Calibrated to match any specific empirical economy.
- Equipped with multi-sector input-output structures, taxation systems, commercial credit, central banking institutions, or endogenous firm entry.
- Capable of estimating real-world fiscal multipliers, welfare impacts, or official policy consequences, as labour-market matching is frictionless and prices are perfectly transparent.
The project's formal interpretive boundary remains: "Under these explicit rules and parameter configurations, this treatment modifies the distribution of simulated trajectories in this specific manner."
Limitations of current results
- Small seed sample: 20 seeds provide an initial diagnostic; the research protocol mandates at least 100 matched seeds before drawing substantive conclusions.
- Pending sensitivity analysis: Parameter sweeps have not yet evaluated varying shock depths, shock durations, transfer payment sizes, or key behavioral elasticities.
- Static snapshot: The accompanying figures and tables summarize a single batch run; they do not trigger real-time re-simulations on page load.
Project roadmap
The repository roadmap establishes the development sequence:
- Version 0.3: Introduces systematic sensitivity testing, modular parameter configuration files, empirical behavioral validation, and endogenous firm-entry mechanics.
- Version 0.4: Calibrates baseline agent initialization against public Canadian microdata and macroeconomic time series.
- Future releases: Incorporates sector-level input-output linkages, a banking and credit sector, fiscal policy with endogenous budgets, and modular AI-driven decision agents benchmarked directly against rule-based baselines.
Each added mechanism will be introduced strictly alongside an explicit theoretical hypothesis and a predefined validation target.