Synthetic weekly prices in a generic local currency unit (LCU), generated by the notebook's seeded simulation model. Harvest calendars, operational costs, trading margins, and shock scenarios are illustrative. No empirical price data from FAO, WFP, or national statistical agencies are used; these figures do not represent any real-world market, agency, or program.
How to read this example
Core question. What price information must an irrigation development authority and its financing partners monitor each week regarding farm-gate realities, and which operational decisions should that intelligence inform?
System function. The platform tracks paddy and onion prices across four market nodes (farm gate, a rural valley assembly market, a regional wholesale hub, and the capital terminal market) alongside an import-parity price benchmark for rice. It flags price movements that deviate abnormally from historical seasonal patterns, measures the proportion of terminal market value captured by producers, evaluates the financial viability of grain and produce storage, and produces 12-week probabilistic forecast bands.
Key findings on synthetic data. The alert mechanism successfully detects 8 of 9 injected shocks within two to five weeks of onset, generating false-positive flags in only 1.7% of ordinary weeks during the baseline period and 4.9% during the live monitoring year. Storing paddy from the December harvest until the August lean season (soudure) yields a net loss of approximately 318 LCU per tonne (−1.1%) under a 1.5% monthly financing charge; conversely, marketing in April generates a net gain of roughly 1,780 LCU per tonne (+6.0%). For onions, storage from April to September earns 1,241 LCU per tonne (+8.2%) assuming a 5.0% monthly physical spoilage rate, but ceases to be profitable once monthly losses exceed 6.2%.
Methodological boundary. This document does not present an empirical evaluation of an actual physical market. The data are generated by a parameterized simulation model that the notebook subsequently analyzes. Consequently, the findings validate the analytical pipeline and implementation code rather than real historical price series.
Context
In an irrigated river valley in the Sahel, agricultural marketing is concentrated around distinct harvesting windows: two paddy rice harvests (the rainy season and the hot off-season) and a major cold dry-season onion harvest arrive on local markets over short timeframes. Prices drop sharply during harvest gluts and rise steadily toward the pre-harvest lean period (soudure). Smallholders compelled to liquidate produce immediately upon harvest to service input loans inevitably sell at the seasonal trough. Meanwhile, imported milled rice imposes an upper price ceiling on domestic rice via import parity, and road transport costs between the valley and the capital establish the equilibrium spatial spread between the two markets.
An agency financing irrigated perimeters, together with supporting development partners, must determine whether farm-gate price fluctuations represent standard seasonal variations, whether production basins remain integrated with urban consumption centers, and whether capital investments in community storage, local milling, or inventory credit (warrantage) are financially viable. Addressing these operational questions requires continuous, weekly market intelligence rather than retrospective, ad hoc market surveys.
Analytical approach
Data structure. The dataset comprises six years of weekly price observations (16 November 2020 to 2 November 2026) across nine individual price series. Weeks 1 to 260 establish a five-year historical baseline; the final 52 weeks serve as a simulated live monitoring campaign. The underlying generator models crop calendar seasonality, a 4% baseline annual inflation trend, persistent international rice price dynamics and exchange-rate fluctuations, and seven stylized shock events: an onion supply deficit, currency depreciation, an international rice price surge, road transport disruptions, an onion supply glut, localized rice market congestion, and premature depletion of onion reserves.
The illustrative import-parity price for rice () is specified as:
where represents the international price in USF55 per tonne), is the nominal exchange rate (LCU per US\taumc^{port}_tc^{haul}_t$ represent port clearance and inland freight costs expressed in LCU per kilogram.
Seasonal norms and anomaly detection. A robust STL decomposition (the statsmodels implementation of Cleveland et al., 1990) applied to the log-transformed prices over the historical baseline generates a fixed 52-week seasonal profile, denoted by . To guarantee causal integrity, the seasonal norm incorporates solely historical observations:
The four-week exclusion lag prevents an emerging price anomaly from contaminating its own baseline calculation for a full month. The corresponding tolerance envelope is defined as , where denotes the robust standard deviation of estimated across the baseline period. A market alert is triggered when observed prices remain outside the band on the same side for consecutive weeks (default baseline settings: , ). This formulation adapts the World Food Programme's ALPS indicator (WFP technical guidance note, 2014) to weekly frequencies, accommodating both inflationary surges and price collapses.
Price spreads, marketing margins, and market integration. The spatial spread represents the absolute price differential between the capital terminal market and the rural valley assembly market. The marketing margin measures the share of the capital wholesale price that fails to reach the farm gate, with paddy converted to milled-rice equivalent using a standard 0.65 milling recovery ratio (net of milling service fees). Spatial price transmission between Valley Market A and the capital is estimated through a two-step Engle–Granger cointegration framework and an Error Correction Model (ECM), following the diagnostic methodology synthesized by Rapsomanikis, Hallam, and Conforti for the FAO (2003).
Storage economics. For one metric tonne of produce purchased during harvest month and marketed months later at seasonal-norm price levels, the net return is calculated as:
where represents monthly price drift, is monthly physical storage shrinkage, is the monthly opportunity cost of capital (financing rate), and represents monthly warehousing fees per tonne. Default parameters reflect regional benchmarks: 0.5% monthly shrinkage for paddy under improved warehousing (consistent with APHLIS post-harvest loss tables), 5.0% monthly loss for onions in traditional ventilated sheds, an inventory financing charge of 1.5% per month, and storage fees of 250 and 400 LCU per tonne per month for rice and onions, respectively.
Forecasting models. Three candidate model specifications are fitted to log-transformed price series: a seasonal naïve benchmark, a SARIMA(1,0,0)(0,1,0)[52] model with drift, and an STL decomposition combined with damped-trend exponential smoothing, implemented within the forecasting framework of Hyndman and Athanasopoulos (Forecasting: Principles and Practice). Models are evaluated using a rolling-origin backtest across the 52-week monitoring period, incorporating 11 evaluation cut-offs over forecast horizons ranging from 1 to 12 weeks.
Simulation results and diagnostics
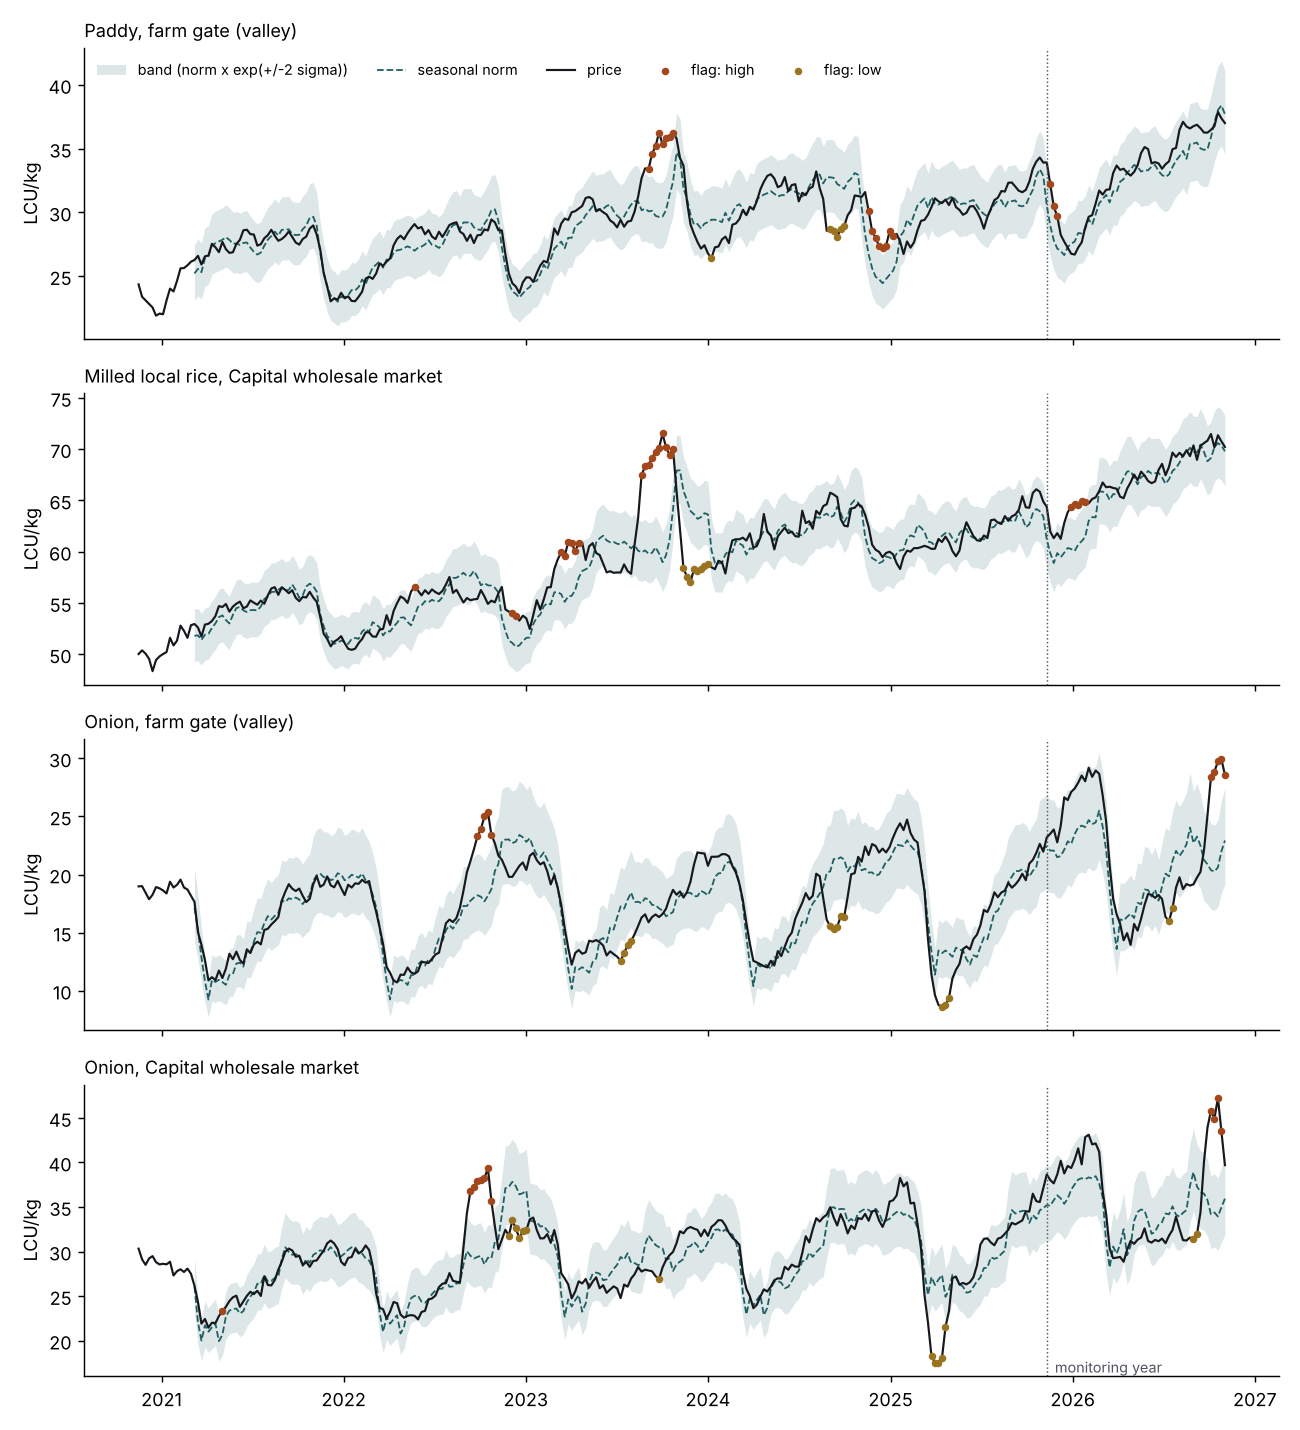
Anomaly detection. Seasonality exerts a substantial influence across both value chains: the farm-gate seasonal index for onions ranges from −50% at peak harvest to +25% during the pre-harvest lean period, while paddy prices swing between −14% and +10%. Under default threshold parameters (, ), the system flags eight of the nine injected shock scenarios, with a median detection latency of 2.5 weeks. The algorithm fails to signal only the 10% decline in valley rice prices in December 2025 across all sensitivity settings, as that drop coincides with the regular seasonal harvest trough. Expanding the tolerance band to maintains all eight detections while reducing false alarms close to zero, at the expense of a half-week increase in detection lag. This operational trade-off depends on expected shock amplitudes and should be re-estimated when calibrating against field data.
Price differentials and margins. During the final monitoring week, the spatial spread for milled rice stands at 7.39 LCU/kg (accounting for 10.5% of the capital wholesale price), compared with a five-year historical average of 7.14 LCU/kg for the identical calendar week. Approximately 10.6% of the capital rice price is absorbed along the marketing chain before reaching the farm gate (against a baseline average of 11.9%); for onions, the uncaptured margin stands at 28.0% (against a historical benchmark of 36.1%). Domestic milled rice trades at between 79% and 84% of import-parity cost depending on the simulated marketing year.
Transmission dynamics. Price series between the production basin and the capital market exhibit robust cointegration (Engle–Granger test, ). On average, 31% of an instantaneous price variation in the capital is transmitted to valley rice markets within the same week, and 44% is transmitted for onions, aligning closely with the structural coefficients of 30% and 40% embedded in the data-generating process. However, the linear specification underestimates the true speed of error correction: estimated adjustment coefficients are −0.16 per week for rice (versus a true value of −0.25) and −0.15 for onions (versus a true value of −0.35). This attenuation occurs because harvest-period freight congestion and road closures are absorbed into the residual error term. In empirical settings characterized by trade-flow discontinuties, this bias may widen; the estimated coefficients should thus be interpreted as baseline orders of magnitude rather than precise structural elasticities.
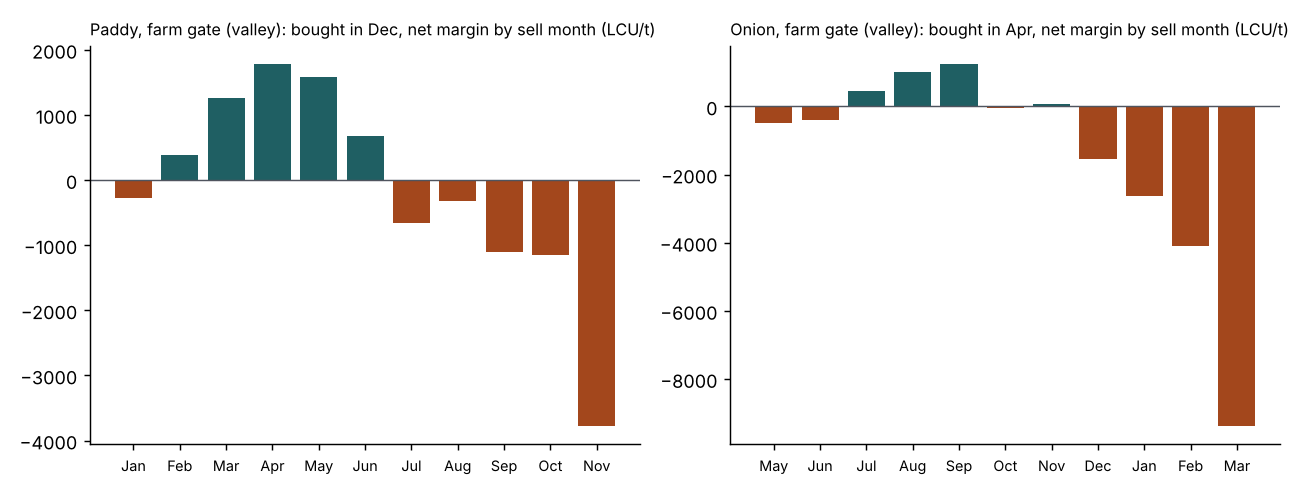
Storage decision modeling. Paddy inventory retention is economically viable only across a constrained seasonal window: produce stored in December and sold between February and June generates positive returns, peaking in April (+1,780 LCU per tonne). In contrast, retaining stock until August results in an average net loss of 318 LCU per tonne, as off-season crop arrivals depress wholesale prices in June and July while capital carrying costs accumulate. The internal break-even financing rate for the December-to-August retention strategy is 1.37% per month. Onion storage returns are dominated by physical spoilage: holding stock from April to September generates a net return of 1,241 LCU per tonne at a 5% monthly weight loss, rising to 4,512 LCU per tonne if losses are contained at 2%, but turns negative once physical losses exceed 6.2% per month. Technical investments in loss reduction yield substantially higher economic gains than adjustments to marketing timing.
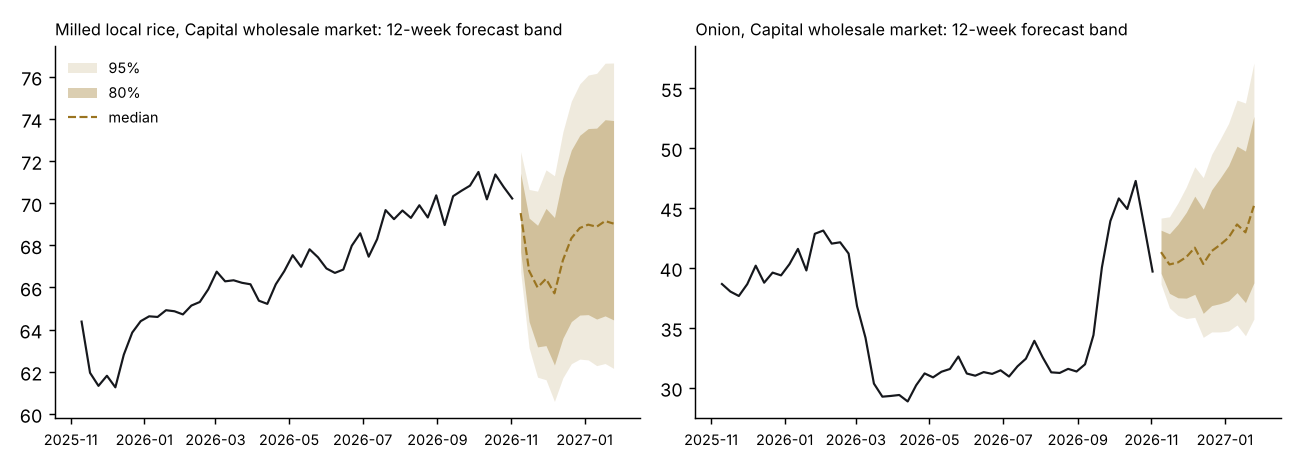
Forecasting performance. For paddy rice, the SARIMA specification achieves a Mean Absolute Percentage Error (MAPE) of 2.0% at horizons of 1 to 4 weeks and 3.4% at horizons of 5 to 12 weeks; its 80% prediction intervals prove overly conservative, covering 90% of realized outcomes. For onions, the combined STL and exponential smoothing approach demonstrates superior accuracy over 5 to 12-week horizons (MAPE of 11.0% versus 14.9% for SARIMA), though its 80% prediction intervals capture only 68% of realized values. The baseline seasonal naïve model is consistently outperformed across all evaluation horizons. Operationally, the pipeline deploys SARIMA for rice and STL-exponential smoothing for onions, displaying prediction intervals rather than single-point estimates.
Bulletin structure and stakeholder decision mapping
| Bulletin Component | Primary Stakeholder | Operational Decision Supported |
|---|---|---|
| Current prices, gaps to norm, and alerts | Producer cooperatives, project planning unit | Immediate marketing vs. temporary withholding; initiation of supply-chain diagnostic inquiries |
| Spatial spreads and marketing margins | Cooperatives, wholesale traders, commercial lenders | Feasibility of long-distance dispatch to urban hubs; assessment of value-chain capture |
| Domestic rice vs. import parity | Planning unit, development partners | Evaluation of domestic rice price competitiveness against international imports |
| Storage net-margin calculator | Warehouse operators, microfinance institutions | Storage feasibility; maximum sustainable interest rate on inventory credit (warrantage) |
| 4- and 12-week outlook bands | Regional agricultural directorates | Planning of agricultural credit lines, input procurement schedules, and harvest release pacing |
The companion template provides a concise, one-page weekly bulletin: a core summary table, two analytical paragraphs covering alerts and margins, a storage decision readout, probabilistic outlook bands, and data quality caveats. Summary outputs can be broadcast to producer groups via automated SMS or audio services, while full diagnostic reports are delivered to regional planning directorates.
Operational data collection protocol
- Market selection and product standardization. Enumeration should cover farm-gate transactions across three to five representative irrigation perimeters, two primary valley assembly markets, the regional wholesale market, the capital wholesale terminal, and the maritime port of entry for imported rice. Commodities must be cataloged by explicit technical grades (paddy by variety and grain moisture content; milled rice by percentage of broken grains; onions by size classification and cured state).
- Field enumerator guidelines. Data collection should occur on consistent days and times each week; enumerators must sample at least three independent traders per market and commodity; prices must be converted directly to standard kilogram units through physical test-weighing rather than relying on variable volumetric measures; mobile data capture forms must enforce GPS verification and automated timestamps, alongside qualitative fields capturing transit bottlenecks and trade disruptions.
- Quality assurance workflows. The ingestion pipeline should enforce automated range and week-on-week variance checks, programmatic validation of unit conversions, supervisory call-back audits on a random 10% sample of records, and transparent logging of imputed or rejected observations.
- Integration with international databases. The local monitoring system should link with the FAO GIEWS Food Price Monitoring and Analysis (FPMA) tool for international benchmarking, and cross-reference monthly WFP market data published on HDX via HDX Signals market monitoring. Because these secondary datasets are reported monthly at national or regional aggregations, they should serve to validate and contextualize valley-level weekly series, rather than substitute for them.
Methodological limitations
- Synthetic baseline properties: The underlying series are generated by a stylized simulation model; recovering this structure confirms the internal validity of the estimation code, but does not substitute for empirical field testing on uncurated market data.
- Static seasonal parameters: The fixed 52-week seasonal baseline does not account for real-world seasonal shifts triggered by irregular rainfall onset, flood timing, or administrative canal irrigation rotations.
- Linear transmission assumptions: The linear error correction model does not capture threshold dynamics stemming from fixed logistical overheads, nor does it model potential asymmetric responses between positive and negative price shocks.
- Simplified storage valuation: Storage profitability is evaluated against historical seasonal averages rather than dynamic, forward-looking price projections, and does not incorporate price premiums for professionally cleaned, sorted, or packaged stock.
- Structural break vulnerability: Forecasting models calibrated over a five-year baseline lack the predictive architecture to anticipate unprecedented macroeconomic, climatic, or geopolitical disruptions.
Field validation and implementation pathway
To pilot this architecture within an active development initiative, implementation should proceed through three progressive phases:
- Parallel pilot run: Operate the data collection pipeline alongside existing monitoring systems for a full agricultural season, using the first year of empirical data to recalibrate the seasonal baselines and alert envelopes.
- Qualitative reconciliation: Conduct monthly cross-validation meetings with field agronomists to compare quantitative market alerts against observed logistical and agronomic realities.
- Impact and behavioral tracking: Monitor three performance metrics: the proportion of statistical alerts confirmed by ground evidence, the empirical coverage rate of the 80% forecast bands, and measurable changes in the timing of commercial sales among cooperatives receiving the storage bulletin. This behavioral effect can be robustly identified using a randomized, phased rollout across irrigation perimeters.